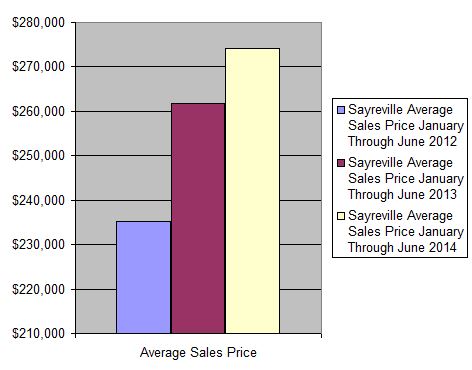
 Home values in Sayreville NJ have been increasing over the past 2 years. The chart on the left shows how the average home sales prices in Sayreville (for single family home, condominiums and townhouses) has increased from the first 6 months of 2012 when compared to the same period in 2013 and 2014. The number of sales in each period are as follows:
- 2012 127 Closed Home Sales
- 2013 154 Closed Home Sales
- 2014 147 Closed Home Sales
The average days on the market for for homes sold in Sayerville
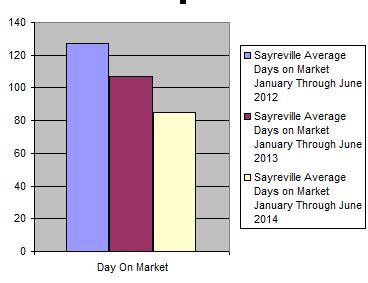
has decreased over the last 3 years as the chart on the right indicates for the same time periods. For the first 6 months of 2014 33% of the homes if Sayreville were on the market for 30 days or less as compared to 32% or less in 2013 and 24% in 2012. Overall the real estate market in Sayreville is in step with the overall rebound in the central New Jersey. Home sales in Sayreville should continue to hold steady for the reminder of 2014. Click here to view currently available homes of sale in Sayreville NJ
- Robert Geist's blog
- Login or register to post comments
 Google+